Let us try to understand peak to average power ratio (PAPR) and its typical value in an OFDM system specified per IEEE 802.11a specifications.
What is PAPR?
The peak to average power ratio for a signal is defined as
, where
corresponds to the conjugate operator.
Expressing in deciBels,
.
PAPR of a single sine tone
Consider a sinusoidal signal
having the period
.
The peak value of the signal is
.
The mean square value of the signal is,
.
Given so, the PAPR of a single sine tone is,
.
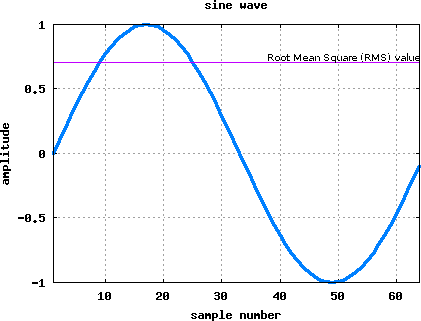
Figure: Wave form of single sine tone
% Example Matlab/Octave script
clear all
close all
xt = sin(2*pi*1*[0:1/64:0.999]);
plot(xt,'b.-','LineWidth',4)
grid on
xlabel('sample number')
ylabel('amplitude')
title('sine wave')
meanSquareValue = xt*xt'/length(xt)
peakValue = max(xt.*conj(xt))
PAPR of a complex sinusoidal
Consider a sinusoidal signal
having the period
.
The peak value of the signal is
.
The mean square value of the signal is,
.
Given so, the PAPR of a single complex sinusoidal tone is,
.
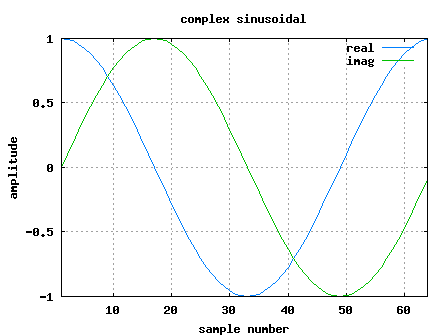
Figure: Waveform a single complex sinusoidal
close all
clear all
% defining a signal in frequency domain
% subcarrier +1 alone
xF = [zeros(1,6) zeros(1,26) 0 1 zeros(1,25) zeros(1,5) ];
xt = 64*ifft(fftshift(xF));
meanSquareValue = xt*xt'/length(xt)
peakValue = max(xt.*conj(xt))
plot(real(xt),'b','LineWidth',2)
hold on
plot(imag(xt),'g','LineWidth',2)
xlabel('sample number')
ylabel('amplitude')
title('complex sinusoidal')
legend('real', 'imag')
grid on
Maximum expected PAPR from an OFDM waveform
From the previous post (here), we have learned that an OFDM signal is the sum of multiple sinusoidals having frequency seperation where each sinusoidal gets modulated by independent information
. Mathematically, the transmit signal is,
For simplicity, let us assume that for all the subcarriers. In that scenario, the peak value of the signal is,
.
The mean square value of the signal is,
.
Given so, the peak to average power ratio for an OFDM system with subcarriers and all subcarriers are given the same modulation is,
.
It is reasonably intuitive that the above value corresponds to the maximum value of PAPR (when all the subcarriers are equally modulated, all the subcarriers align in phase and the peak value hits the maximum).
PAPR in IEEE 802.11a OFDM transmission
Per the IEEE 802.11a specifications, we have used subcarriers. Given so, the maximum expected PAPR is 52 (around 17dB!!). However, thanks to the scrambler, all the subcarriers in an OFDM symbol being equally modulated is unlikely.
Using a small script, the cumulative distribution of PAPR from each OFDM symbol, modulated by a random BPSK signal is obtained.
Click here to download.
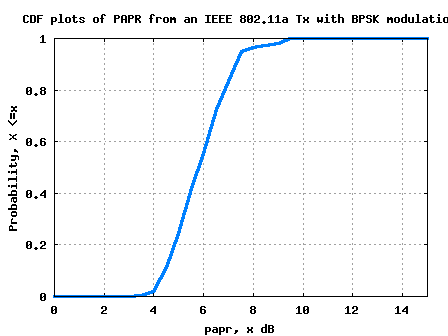
Figure: Cumulative distribution (CDF) plot of PAPR from a random BPSK signal
As can be observed, the observed PAPR seems to be distributed from around +3.5dB to a maximum value of 10dB.
References
Hope this helps.
Krishna
hi sir, i am doing project on tone reservation…in need matlab coding for tone reservation in receiver part…..can u please help me sir….
@divya: sorry, i do not have any posts on tone reservation
How to find backoff value for an RF Power amplifier in relating with OFDM concept
@SHOBA: The idea is to ensure that the peak value of the signal does not go into the non-linear region of the amplifier. Given that the peak-to-average ratio is typically 9dB (atleast for 802.11a/g), the back off factor is 9dB.
hello Sir,
I am doing work on PAPR reduction would you please help me which reduction technique provides best reduction performance with low complexity , and will be convenient . which tool i have to use for coding purpose ??
@Amit: ‘ve not studied the topic in much detail, however some links which I picked up from a googling longback:
(a) Tone reservation : where some of the unused subcarriers in an OFDM system is modulated to reduce the PAPR.
(b) MERL has a paper on PAPR reduction by oversampling, soft clipping and filtering.
PAPR Reduction for WiMAX OFDM Systems
http://www.merl.com/projects/papr/
(c) Nice comp.dsp thread on this topic
Has The peak-to-average ratio problem of OFDM been solved?
http://tinyurl.com/6jn9ql
Matlab is a good tool to be used for modeling.
Hi Krishna,
I have the following question:
Why the ifft is multilpied by 64? I don’t understand this normalization factor.
Thank you very much.
Regards,
Felipe
@Felipe: The ifft() implementation in matlab/octave has a scaling by N, where N is ifft size. To compensate that outside, used the multiplication by 64.
Thank you Krishna, but why do you need to compensate the outside of the ifft?..to mantain values of average power in frequency and time the same?, What about Parseval theorem?
I am confused about how the average power is calculated in frequency domain, and how the average power is calculated in time domain?
Thank you very much.
Regards,
Felipe
@Felipe: The scaling factor for ifft()/fft() is always a confusing topic for me. It’s an implementation choice made by Mathworks (or Octave).
Please look at this thread
http://www.mathworks.com/matlabcentral/answers/15770-scaling-the-fft-and-the-ifft
Thank you very much Krishna.
Regards,
Felipe
sir can i use octave in wista os or windos 7 os? if yes thn where can i get it?
@anand: Octave for windows is available. Please check
http://www.gnu.org/software/octave/download.html
Have not checked whether it is compatible to Vista or Windows7, but should be ok, I reckon.
Hi Sir ,I am doing my M-tech thesis in OFDM system, and I have to apply Peak to Average Power ratio using clipping and filtering in MATLAB.Please guide me
@Eshaan: I have not studied this topic much, but please take a look at
http://www.altera.com/literature/wp/wp-01090-cfr-ofdm-wireless.pdf
Sir I have to understand about the concept of adding cylcic prefix.Please tell me
@eshaan: Please look at
https://dsplog.com/2008/02/17/cylcic-prefix-in-orthogonal-frequency-division-multiplexing/
for coding on this topic u can contact me on 09493148685
dear krishna Sir,
will you please help me in implementation of SLM technique for papr reduction?
i need coding of it in matlab
@prashant: sorry, i have not studied SLM technique for PAPR reduction
sir, we will be pleased if u help me by sending the coding to implement MIMO system..
@Preethi: Please look at https://dsplog.com/tag/mimo
sir, i am doing project on PAPR reduction by clipping and differential scaling. i need to plot BER vs PAPR.can you send me the codes related to the above mentioned topic.
@divakaran: Sorry, I have not worked much on this topic
Hello Krishna
Can you send me copy of matlab version to set up it on my PC , I hope you can send me as soon as possible please
Regards
Sam
@sam: Matlab is a copyrighted software which you can purchase from Mathworks.
For my simulations, I use octave.
http://www.gnu.org/software/octave/
meanSquareValue = xt*xt’/length(xt)
this is just the mean power of the signal
and
I think we should do the opertation of sqrt() to get the right meanSquareValue,
Regards!
@Michael: If we put sqrt(), it becomes root mean square (rms) 😉
hi krishna,
can u suggest different types of papr reduction techniques. i dont have a clue about that…. can u help me out n basic papr programming….i new to this papr… and do u have coding for clipping and filtering for papr reduction for ofdm….
@sheena: I have not explored the PAPR reductions techniques. However clipping is a brute force approach where we limit the signals to a pre-defined limit. The impact of clipping is that it creates both inband and outofband frequencies.
i am having coding for clipping
you can get it on google if u searched like name “baher mohamed coding for ofdm”.
and if u able to find coding on SLM technique then please forward it to me on pmjadhav85@gmail.com i badly need it
Hi Krishna,
to plot CCDF curve, is it true to make several iteration? not only one value? i’m doubt if it curve is iteration value. in my opinion, the CCDF is derivation from PDF, and CDF. so CCDF is from the output signal from OFDM, not the value from PAPR with several iteration.
sorry for my bad english, coz i’m not a native speaker 😀
@budi: Did you mean several realization of an OFDM symbol? This post I believe has multiple OFDM symbols used
I want to compare the BER performance of OFDM receiver implemented with PLL and free running multivibrator as odscillator. Can u please help me out ,,,it, urgent I hve to submit my thesis….
@Ojasvi: Sorry, nothing handy
it, s okay can u please guide me some reference material for this..
@Ojasvi: Hmm… well i have not searched for this topic
Hello sir,
Actually I am modelling OFDMA in matlab, but I am having problem in visualising as to how will the subcarriers be dynamically allocated to the users according to availability of subcarriers and the number of users??
@Akshay: Am also not sure on this resource allocation topic.
I am Preethi studying Final Year Engineering. As i’m approaching my final semester project i’m in need of matlab coding to reduce the PAPR in OFDM and MIMO OFDM using the following techniques,
1)The Partial Transmit Sequence Technique
2)The Selected Mapping Technique
3)The Interleaving Technique
Kindly lend me some matlab codings to enhance my project.Thank you.
@Preethi: I have not tried to model any of the above mentioned PAPR reduction methods in Matlab
hi preethi
i am having matlab coding for clipping technique
will you please help me for SLM technique?
@prashant: sorry, i have not studied SLM technique
Thank you very much for clearing this thing off!
Hi Krishna
I have a doubt regarding CCDF vs PAPR curve. In so many papers I’ve observed that CCDF values will range from 10^0 to 10^(-5) or 10^(-6). But in my plot of CCDF vs PAPR curve for 32 subcarriers the value of CCDF varies from 10^0 to 10^(-3) only. Is it ok or there is some problem? Please reply asap.
@sanjay: Depends on the resolution of your histogram computation. Did trying to change that help?
plz provide me with the code fr papr reduction in ofdm signal using coding technique..
@praveen: Sorry, I do not have.
sir i need matlab code between SNR vs BER of OFDM.
please any one help me to get this code.
@Rathod: Please look @
https://dsplog.com/2008/06/10/ofdm-bpsk-bit-error/
https://dsplog.com/2008/08/26/ofdm-rayleigh-channel-ber-bpsk/
hello sir…
i am doing my project of m.e on adaptive resource allocation for mimo-ofdm based wireless multicast system
can u please help me how to write codings ..is it easy
@sharmila: coding might not be easy, but still its a good project to work on. good luck.
Hi Krishna Sankar.
I dont know how to choose CR(clipping ratio) in Cliping method to reduce PAPR in OFDM. So please help me
@vilan: Well, I do not think there is an exact threshold for choosing the clipping ration.
If we clip too much (ie make clipping threshold low), then we increase the distortion of the OFDM signal. This non-linear operation will result in frequency components to be generated in the in-band and out of band. The in-band frequency components will cause EVM degradation. The out-of-band frequency components needs extra filtering to be removed…
If the underlying modulation is BPSK, we can tolerate higher EVM loss, but thats not the case with 64QAM modulation….
Hi all!
I am very confuse about clipping and filtering method for reducing PAPR.
I only know after clipping, using these commands:
%filtering
C = fft(x_cl);
C(Nc/2+1:N-Nc/2,:) = zeros(N-Nc,length(CR)+1);
x_cl = ifft(C);
Intead of that method, I want design FIR filter.
Please help me.
thanks
@all: sorry all because my skill English is poor.
Help me
@vilan: Both clipping and filtering happens in the time domain samples. After clipping pass it through a FIR filter. You can use conv() function in Matlab for modeling FIR filter
@Krishna Sankar: I dont know which type of filter to reduce out of band and when we choice a filter, how to submit a low cutoff of stopband and high cutoff of stopband.
Help me.
@vilan: You can chose a filter whose 3dB bandwidth is ‘slightly’ more than the max frequency of your OFDM waveform.
sir i am doing my project of mtec on papr control in ofdm .
can u please mail me some site for this
@manisha: Some relevant links which I picked up from a quick Googling.
(a) Tone reservation : where some of the unused subcarriers in an OFDM system is modulated to reduce the PAPR.
(b) MERL has a paper on PAPR reduction by oversampling, soft clipping and filtering.
PAPR Reduction for WiMAX OFDM Systems
http://www.merl.com/projects/papr/
(c) Nice comp.dsp thread on this topic
Has The peak-to-average ratio problem of OFDM been solved?
http://tinyurl.com/6jn9ql
Sir,
I’m working on PAPR reduction. In the ccdf plots, could i know what range of values are assigned to the x axis?
Thanks!
@anita: That depends on the signal strength of the waveform. If the target signal strength is xdBm, the signal can potentially go as high as x+10dBm around…
I’m research to reduce PAPR by Partial Transmit Sequence (PTS)? Do u have code or algorithms about PTS?
@nhocthuy: Sorry, I do not have code for PAPR reduction by PTS
Hi krishna
I’m trying to plot CCDF vs PAPR plot for DVB-T. MATLAB code for implementing DVB-T is given at:
http://www.ece.gatech.edu/research/labs/sarl/…/OFDM/Tutorial_web.pdf
I’m not able to figure out what basic changes has to be done in OFDM transmission side program so that I may get CCDF vs PAPR curve.
Please help
@sanjay: No need to make any basic changes. Take the time domain waveform of the OFDM symbol. Take the histogram (to find the PDF) and then do a cumsum to find the CDF. 1-CDF gives the CCDF.
In the post https://dsplog.com/2008/02/24/peak-to-average-power-ratio-for-ofdm/ there is an example for finding the CDF. Hope that helps
Hello Sir,
could you please tell me why we get low peak to average ratio if we amplify ofdm signal with traditional amplifier like class A,B and also switch mode amplifiers class E,F and S. If you have any relative link then could please tell me.
Thanks
Regards
@Jaspreet: OFDM waveform has an inherently high PAPR. So, am not sure how the power amplifier will cause the PAPR to reduce. If the PA is forced into saturation, then the non-linearities introduced by the PA will cause erroneous demodulation.
Respected Sir,
Currently working on PAPR and your Comments really helped a lot, now i have 2 questions
1. How to plot Pr(PAPRx>PAPR0) vs PAPRo(dB), which is in fact another view of PAPR performance i think, it gives you BER kind of water falling curve. How do i plot that?
2. what are the “characteristics of a signal” that cause this PAP problem,
I mean if we would have known about the features are going to cause this problem, we could think about some new techniques to reduce this PAPR stuff.
Thank You..
@Solid M: My replies
1/ I think you are looking for CCDF plot. In the post, the Matlab model shows the CDF plot generation. Taking 1-CDF is CCDF.
2/ Adding many sinusoidals which align in phase cause this problem
thanks a lot for these demonstration
Hi Mr.Krishna!!!
https://dsplog.com/2008/02/24/peak-to-average-power-ratio-for-ofdm/
in this code you have calculated the PAPR of the OFDM signal,
also,
https://dsplog.com/2008/06/10/ofdm-bpsk-bit-error/
in this code you have calculated the BER of the OFDM signal,
but,
(1)how to calculate the BER of the OFDM signal in that previous(PAPR) coding itself,
i tried to calculate that with that previous coding, but it ends up with failure results and i don’t know how to calculate it there too…
(2)Can you guide me how to calculate the BER of the OFDM signal in that PAPR coding itself…
(maheshr.ece@gmail.com this is my id)…
(3)also i want to know more about PAPR problems and its impact with Power Amplifiers too.. just provide me the links…
with hope and Lot of thanks,
Mahesh R
@Mahesh: My replies
1), 2) Well, you can try to modify the BER in OFDM code to display BER and PAPR too.
2) http://en.wikipedia.org/wiki/Crest_factor
I have decided to do my research on papr on ofdm .Can u please tell me Recent techniques of papr on which i can work.
@mohanajaishankar: Sorry, I have not been following the recent algorithms
Hello Sir,
Do you have any info about ray launching in MATLAB codes. Then, for this moment I’m try hard to find on how to obtain power received (PR) from rays that launched also in MATLAB. I hope can hear from you as sson as possible about this post.
Thanks in advance,
Maxi_84
@Maxi_84: Sorry, I do not have much info on this topic
hi
please can help me to understsnd equation of ofdma in time domain and also can send me matlab code about ofdma
the equation of ofdm is
wosamw@gmail.com
thanks
@wosamw: In OFDMA, the multiple subcarriers are assigned to different users. Sorry, I have not yet discussed OFDMA in any posts.
hi Sir,
need your help.
i’m currently doing PAPR reduction in OFDM. i’ve the therotical part done and now i need to simulate using matlab.
could you please provide me matlab coding so i can have a look at the generated graphs and the command.
appreciate your help. thanks
@Girish: Sorry, I do not have simulation models on PAPR reduction
hi Girish,
i’m researching about reducing PAPR in OFDM methods, such as: clipping and filter; selected mapping (SLM);partial transmit sequence (PTS). I have understood and finished therotical part. But now, i don’t know how simulate in matlab. Do you have code matlab?. If you have it, please provide it for me. my email: vulam405@gmail.com.
appreciate your help. thank you very much
lam_ngo87
@lam_ngo87: Sorry, due to time constraints may I decline to help with the coding aspect.
Hello sir,
I am doing my project on reduction of peak to average power ratio using clipping method.Can you please help me by sending some previous topics and any extra matter relating to that.
Many Thanks,
Vikram
@Vikram: Sorry, I have not done much study on PAPR reduction.
Some relevant links which I picked up from a quick Googling.
(a) Tone reservation : where some of the unused subcarriers in an OFDM system is modulated to reduce the PAPR.
(b) MERL has a paper on PAPR reduction by oversampling, soft clipping and filtering.
PAPR Reduction for WiMAX OFDM Systems
http://www.merl.com/projects/papr/
(c) Nice comp.dsp thread on this topic
Has The peak-to-average ratio problem of OFDM been solved?
http://tinyurl.com/6jn9ql
Hi,
Ya we need to do oversampling for better estimate. Please refer the OFDM Multimedia communication book by R van Nee & Ramjee Prasad .
Thanx
amit
@amit: Am a bit surprised. By how much factor does the accuracy improve when we do oversampling.
dear sir,
Can you tell about sfbc ofdm, 1. what is the high power amplifier(SSPA) with backoff, how this effects on BER performance (backoff=0 or 2).
2. what is JSR=0,0,1,1. or JSR= 0,1. in narrow band interference(NBI),how the OFDM effected by this NBI(JSR=0,1 or 0,0,1,1).
will you give idea for implimenting this in MATLAB or will you send MATLAB codes.
thank you very much
@srinu: My replies:
I have not discussed much on Space Frequency Block Coding OFDM. However, the concept is simple. Instead of coding over the space dimension, we will be allocating code across different subcarriers in the same OFDM symbol
1/ If OFDM systems, to avoid non linearity from the power amplifier due to the high peak to average ratio of OFDM systems, we need to backoff.
2/What does the acronym JSR stands for? Sorry, am not aware.
Hi,
I have used the matlab code of PAPR given in this blog, the result obtained by it are not matched with theroy and with the plots given in books/papers.
What are the modification that i have to perfrom if I want to do oversampling by a factor L in order to get the better estimate od PAPR.
I got very good help by this blog.
Thanks
Amit
@amit: Well, can you please point to the books which you refered to, when you said that the results from this simulations are not comparable to theoretical results.
Well, do we need to do oversampling for getting a better estimate of PAPR?
Hello sir!
Can u tell me about influence of HPA (high power amplifier) to reducing PAPR, please? Do u have this code? Thanks and regarding!
@nhocthuy: Well, typically PA’s do not like signals having high PAPR – as the peaks of that signal will cause PA’s to be non linear.
Hello sir
Iam doing my project on Peak-to-Average Power Ratio (PAR) reduction scheme suitable in block differential systems in matlab.I need help regarding the process and good documentation provided.I hope you can help me.
Many. Thanks,
Vikram.
@Vikram: I have not worked on PAPR reduction approaches. Some relevant links which I picked up from a quick Googling.
(a) Tone reservation : where some of the unused subcarriers in an OFDM system is modulated to reduce the PAPR.
(b) MERL has a paper on PAPR reduction by oversampling, soft clipping and filtering.
PAPR Reduction for WiMAX OFDM Systems
http://www.merl.com/projects/papr/
(c) Nice comp.dsp thread on this topic
Has The peak-to-average ratio problem of OFDM been solved?
http://tinyurl.com/6jn9ql
thank you for your reply
Hi Krishna
Thanks once again for your quick reply. I really appreciate your obesrvation regarding subcarriers loading rules. Though I could not find anything concrete in this regard on the Internet but I think your observation is very much correct.
Hi Krishna
Thanks for your prompt reply.
Suppose if one has to simulate cdf vs papr curve for 128 subcarriers then the ifft size is 128 but how to adjust loading of subcarries? I mean what changes are required as far as subcarrier index is concerned.
pls reply asap at your convenience.
@sanjay: The only rules pertaining to subcarrier loading, which I have seen in wireless communication are
1. do not use DC subcarrier – as DC in the system will corrupt the modulated data
2. do not use subcarriers at edges of the channel – to allow transmit power to not interfere with adjacent channel.
If you have 128 subcarriers then you can consider loading subcarriers [-58 to -1, 1 to 58]. What do you think?
Hi Krishna
Is there any closed form relation to find the number of data and pilot subcarriers for the given total number of subcarriers N? I mean to say that if the IFFT size is N then how to find/approximate the number of data subcarriers and pilot subcarriers irrespective of the standard?
@sanjay: Selecting data subcarriers and pilot subcarriers from the available N subcarriers is an engineering choice. We do not want to have too many pilots – as it will reduce the data rate. Too less pilots will compromise th synchronization performance. For eg,
a) in 802.11a 20MHz mode, we have 48 data subcarriers + 4 pilots out of total 64 subcarriers
b) in 802.11n 20MHz mode, we have 52 data subcarriers + 4 pilots out of total 64 subcarriers
c) in 802.11n 40MHz mode, we have 108 data subcarriers + 6 pilots out of total 128 subcarriers
Hi Krishna
Thanks a lot for your prompt response.
Hi Krishna
I could plot CDF vs PAPR curve with 16-QAM modulation. I have a query now. Suppose I want to simulate cdf vs papr independent of following any standard such as IEEE 802.11 a etc then what changes should be made in your program? I mean to say my MATLAB program should take any number of subcarrires and simulate cdf vs papr curve.
@sanjay: you can change the ifft size and load the subcarriers appropriately.
Hi Krishna
I’m trying to simulate the CDF vs PAPR plot for 16-QAM modulated OFDM signal. I’m confused as what changes I should make to your MATLAB code which you have given here for the simulation of CDF vs PAPR plot of BPSK modulated OFDM signal.
Pls help.
@sanjay: Please refer to the Matlab code in https://dsplog.com/2007/12/09/symbol-error-rate-for-16-qam/ for an example on how to create a 16QAM signal.
Hi, Khrisna,
If I would like to change the subcarriers from 0-52 (not -26 :26). Could you advice me how to adjust the parameters? Will this change the value of PAPR (phase change?)?
The obvious one is I have to change subcarrierIndex=[0:51];
You have inspired so many people! Your website is a great information for signal processing knowledge.
I read your other post and I remove the fftshift so it will go from 0:51. Is that right? 🙂
@Claire: My replies:
1/ Not sure, why you would want to load from 0 to 51.
Anyhow, for loading subcarriers from 0 to 51, use the following code snippet
subcarrierIndex = [0:51];
inputiFFT = zeros(1,nFFTSize);
inputiFFT(subcarrierIndex+1) = ipMod(ii,:);
outputiFFT = 64*ifft(inputiFFT,nFFTSize);
I do not think, it will affect the PAPR.
2/ Thanks.
Thanks, Khrisna.
The reason why I would like to try this out because some papers using 0: number of subcarriers . I am just wondering what is the difference.
@Claire: ok. Good luck.
In the calculation for the average value of the complex sinusoid,
x(t).x*(t) = exp(2.pi.f.t).exp(-2.pi.f.t) = 1,
so E(x(t).x*(t)] = 1/T . Integration[1] from T to 0, giving an average value of 1?
@maria: Aren’t we saying the same thing OR … ?
Dear Krishna sir…
i read a lot of this site and it helped me a lot in my Project,
currently i’m working with COFDM, i mean just started, i thought i was good at OFDM and coding, but stuck with the beginning of Coding like OFDM with RS(n,k). suppose i’ve initiated my OFDM part like follows..
nFFT = 64; % fft size
nDSC = 52; % number of data subcarriers
nBitPerSym = 52; % number of bits per OFDM symbol
nSym = 10^4; % number of symbols
EbN0dB = 0:10; % bit to noise ratio
EsN0dB = EbN0dB + 10*log10(nDSC/nFFT) + 10*log10(64/80);
for ii = 1:length(EbN0dB)
% Transmitter
ipBit = rand(1,nBitPerSym*nSym) > 0.5;
……………….
after that i start my rsenc(msg,n,k) part, now probem is with this n, k and ‘msg’.. if n is my block length then is it equals to the total length, and it is 52×10^4=520000 !!! i shouldn’t have a block length like this as my common sense suggests me…and if it is so, what is my msg then.? or how should i start with, please sir help me out….!!!
@Solid M: If your numbers of bits is not an integer multiple of the block coding rate, you might consider padding the input bits with zeros at the end (and those zeros can be ignored at the receiver). This is the normal practice is most digital communication systems.
And please also let me know what happens at the transmitter side before the IFFT block like how do we deal with QPSK or QAM symbols for multiple different carriers.
@vedika: Well, thats just assigning the modulation symbol to each subcarrier, no?
Would you be tell me where shal i get the relevent information?
I have gone through ieee papers,but didnt get any thing very concrete.
please let me know..
@vedika: Some relevant links which I picked up from a quick Googling.
(a) Tone reservation : where some of the unused subcarriers in an OFDM system is modulated to reduce the PAPR.
(b) MERL has a paper on PAPR reduction by oversampling, soft clipping and filtering.
PAPR Reduction for WiMAX OFDM Systems
http://www.merl.com/projects/papr/
(c) Nice comp.dsp thread on this topic
Has The peak-to-average ratio problem of OFDM been solved?
http://tinyurl.com/6jn9ql
Dear Mr. Krishna,
where is the effective method to plot the CCDF PAPR between use function histogram and then cumsum or use with function cdfcalc in matlab?
Thank you for your kind attention.
Regards,
@Leni: Since I did not have cdfcalc() function, I used histogram+cumsum to plot the CDF. You may see the example of this usage in the Matlab code provided in this post (link provided just above the CDF plot).
If you want CCDF, then plot 1-CDF. Hope this helps.
Hello,
I am working on reduction of PAPR in OFDM
And I am required to use GENETIC ALGORITHM.
please give your opinion or suggestions for the same.
Let me know wat else i need to go through..
@vedika: Sorry, I have not worked much on PAPR reduction techniques in OFDM
I would have thought that different modulation schemes would have different effects on the PAPR. Specially between real only and complex modulation schemes.
@maria: I agree to that. From my quick simulations in the past, I recall observing that the average PAPR with higher order modulations like 16/64-QAM is slightly lower than with BPSK.
Hi,Mr Khrisna.
Thanks for your replay.
I checked the perfomance when the “Transform “is applyed .The results exhibted behaviour closed to convential OFDM specially with White guessian noise channel and with flat fading channel but the worse result introduced when applied selective fading channel .In this case ,We can received the signal when a equilazer algorithm is used .
I wait your reply,Thanks
@algenaby: Why is the result when frequency selective fading is applied? For OFDM, even if the channel is frequency selective, for each subcarrier, the channel is still flat fading, agree?
Hi,Mr Khrisna.
Can be used a block mapping(any Transformation) after IFFT in OFDM.
This scheme effective on orthogonality of OFDM or not.
How can be tested the orthogonality of the proposed system.
———— ——————
BPSK———-> IFFT ————> Transformation ————>
———— ——————
TRANSMITTER
note:-
The Transformation reversibale in the receiver side and gave good results in reduction of PAPR .
What the critera that applied on my scheme to decide this method true or false
@algenaby: If the system is orthogonal, then each subcarrier will not affect other subcarriers. So, you can find the error in the received constellation with and without the “Transformation”. That will let you know whether the orthogonality is affected or not.
Hi Khrisna..
I just want to begin my new research about reducing PAPR or whatever as long as it is relevant with PAPR. I intend to combine the existing technique with artificial intelligent (such as neural network or hidden markov model or GA), is it possible and does it make sense? Thank you
@Filbert: Am not sure, as not familiar. Good luck in your algorithm explorations.
K..Mr.Krishna.
I understood PAPR was occured due to failure of orthogonality.
Or
Due to multicarrier in the form of sum of sinc waves. Therefore sum of the values of sideband or main lobe add at some point and produce very high value. My statements are correct or not…..
@kalidoss: You first statement is wrong. Your second statement is closer to the concept, but is also wrong as its talking about sinc waves and not sine waves. High PAPR happens due to sum of sine waves (not sinc waves) add constructively resulting in peak.
Let me give you a quick example in Matlab/Ocatve
x1F = ones(1,64);
x1t = fft(x1F,64);
papr1_dB = 10*log10(max(x1t.*conj(x1t))/mean(x1t.*conj(x1t)))
x2F = 2*(rand(1,64) > 0.5)-1;
x2t = fft(x2F,64);
papr2_dB = 10*log10(max(x2t.*conj(x2t))/mean(x2t.*conj(x2t)))
You can see that papr1_dB is close to 18dB (as all the subcarriers got added in phase).
For papr2_dB, since there are random +1/-1’s the chances of subcarriers aligning in phase and resulting in high PAPR is less likely.
good article. keep up the good work
@kassim: Thanks
Dear sir, i have started my research in the area of OFDM and MIMO OFDM recently. I have gone through many literatures describing PAPR solutions, also i find some articles PAPR is no longer greater issue, my query is whether i can take up the PAPR is my research issue?
Thank you
Regards,
palanivel
@Palanivel: I do not think PAPR reduction in OFDM has lost relevance. I think it will be a good topic to research as it helps to understand the properties of digital baseband and analog radio.
Khrisna,
I often read papers that stated CDF as
Prob(PAPR<=PAPR0) = (1-exp(-PAPR0))^N
where N is number of subcarriers.
I wonder, can the formula be used for any situation? For any modulation? So my conclusion is the CDF depends only on N. Is that right? Thx
@Filbert: What is PAPR0? In general, if there more subcarriers, then the PAPR is more.
Sorry i forgot to write. PAPR0 is a certain value. Or i can write: Prob(PAPR<=x) = (1-exp(-x))^N
Does it mean when we use same N with different modulation, say, BPSK and QPSK will result the same CDF graph?
@Filbert: Well, in the past I have observed that PAPR for BPSK is slightly higher than that for QPSK.
sir, can u help me simulated PAPR via tone reservation in matlab simulink? it required random set optimization,can u help me? thank u
@dany: Sorry, I have not tried PAPR reduction using tone reservation.
Khrisna,
I wonder if the distribution of the data sent affects the OFDM performance. I use the function “randint(1,n,range)” to generate the integer number and then mapping the data by using “qammod(x,N)”.
In MATLAB’s help, “randint” generates matrix of uniformly distributed random integer. Is it okay? Or the data should be Gaussian distributed?
Thank you
@Filbert: Well, I have not tried studying the difference. However, I would expect that the difference is minimal. If you recall, in the Matlab code, I used rand() function, which generates uniformly distributed numbers to generate the bits.
Hi Krishna
If I was worked a method for reducton PAPR what is the values of parameters that make the method reduction best from another method.
SER versus SNR OR CDF OR What
Thanks agian for your contribution in this field .
algenaby
@algenaby: I tend to think that there is no best way of comparison. The CDF curve will help us to show directly the performance of various PAPR reduction schemes. Then one would be interested to know whether the reduction in PAPR affected the desired signal. There a symbol error rate vs SNR is desired.
Hi Khrisna,
I have simulated the CCDF with QPSK and 16QAM and i notice that when i used 16QAM the ccdf is slightly better than ccdf with QPSK. Is it make sense? If yes, what is the reason? Thank you for your help
Regards,
Filbert
@Filbert: Yes, I think it makes sense. When the modulation is 16QAM, with the modulation alphabets being {+-3,+-1} + j{+-3,+-1}, the chances of all the subcarriers have identical modulation is lower than when the modulation is QPSK (+-1 +-j). Since the chances of having identical modulation is lower for 16-QAM, the PAPR is slightly lower for 16-QAM.
Does this explanation makes sense? Plz share your thoughts.
Khrisna, after i have some readings i found that the PAPR for 16QAM should be worst than QPSK since 16QAM system needs more power than QPSK.
I think it is possible because
[abs({+/-1,+/-3}+ j{+/-1,+/-3})]^2 is greater than [abs({+/-1}+ j{+/-1})]^2
What do you think?
@Filbert: Well, no I do not think so. Recall that PAPR is a relative measure rather than an absolute one. Further for 16QAM constellations, to normalize the transmit power to 1, there is scaling by 1/sqrt(10).
Ok sir, Which other methods are u familiar with which can help in the reduction of this PAPR (Taking DVB into considerstion).
Once more your assistance would be greatly appreciated.
Regards.
@Kingsley: I have not worked much on PAPR reduction apart from having a scrambling at the transmitter to prevent continuous sequence of 1’s and 0’s.
Hi Krishna, this site has been useful to me for a better understanding in PAR problem on OFDM Systems..
Couldo please upload here a post for describing (pseudolenguage) or matlab code how to implement a simple scrambling to mitigate PAR?
Thanks in advance.
Victor
(Venezuela).
@Victor: I have not published any scrambler code, though it should be reasonably simple to code.
The idea is that any long sequence of zeros or 1’s can result in all sinusoidals adding constructively leading to high PAPR. This can be avoided using a scrambler.
Hi to all,
I am doing my research in the area 4G systems. One of my paper need PAPR reduction techniques. Do any one have Matlab code for clipping and filtering?
@Bijukumar: Clipping is a simple, though a brute force way of PAPR reduction. The concept is that any signal above or below a defined rail is clipped to the rail i.e.
y(t) = x(t) , if -v <= x(t) < v = -v, if x(t) < -v = v , if x(t) >= v
However, as you may be aware clipping is a non-linear operation. So, it introduces additional unwanted frequency components both in the inband and outband frequencies. The outband frequencies may be suppressed by having a simple FIR filter. However, note that the unwanted inband frequencies will result in degraded EVM.
Sir, I read your write up its very nice.
I am a new user of matlab and working on a project on the reduction of the Peak to average power ratio problem in OFDM (For digital video bradcasting system, DVB). Could you please help me with the matlab code for soft compression method. Thanks for your assistance.
@Kingsley: Thanks for the comment.
Sorry, I am not familiar with the soft compression method which you are planning to use for PAPR reduction.
Hi Khrisna,
Me again! I know that you use pwelch (in the other code) to plot the PSD but by default, pwelch will use hamming window. Do you have any idea how to plot the original signal in the same plot as the one with the hamming window.
I tried the following for the original psd but I don’t think I can compare the result with the pwelch:
st_fft=1/nFFTsize *fft(st,nFFTsize);
PSD=st_fft.*conj(st_fft);
PSD=10*log(PSD);
but I can’t compare it to the one with hamming window (size 50 here):
[Pxx Wxx]= pwelch(st,50,10,nFFTSize*f,0.3125*nFFTSize)
Thanks again for your advice.
@Claire: Well, are you saying that you are unable to compare the two spectrum plots, obtained via (a) fft and (b) pwelch?
Well, one key aspect is to define the x-axis appropriately. If the sampling frequency of the signal st is fs, then from the output of fft, use
plot([-nFFTsize/2:nFFTsize/2-1]*fs/nFFTsize,10*log10(abs(fftshift(PSD)))
similiarly for the pwelch output also, use
plot([-nFFTsize/2:nFFTsize/2-1]*fs/nFFTsize,10*log10(abs(fftshift(Pxx))); % do not use Wxx
Further, I do not understand some of the parameters which you have passed onto pwelch(). As I recall passing only the fftsize and sampling frequency suffice (for most uses).
Hope this helps.
hai friends,
akansha jain, Srabani Mohapatra, Gulap, srabani mohapatra, Jenny. i think u all are familiar with the ” clipping and filtering ” in that i want signal to clipping noise ratio plot.
Reply
Hi Khrisna,
How are you? I am now trying to simulate the receiver of OFDM (to calculate BER) while in the transmitter i use clipping and filtering.
I got confused one thing. When i use filtering, i think there are some information lost. So what should i do? Thx
@Filbert: Well, if the filter frequency response is flat in the region where the OFDM spectra is present, there should be any loss. Try plotting the frequency response of the filter and the spectrum of the OFDM waveform to confirm that this is indeed the case. Good luck.
hai sir
i am doing a papr reduction in ofdm via “rapeated clippig and filtering” . i have seen many tagss related to this topic, if any one familiar with this please help me, i am very near to my project dead line . provide me any program
hai friends,
akansha jain, Srabani Mohapatra, Gulap, srabani mohapatra, Jenny. i think u all are familiar with the ” clipping and filtering ” in that i want signal to clipping noise ratio plot.
@bunny: Sorry, I have not tried modeling the algorithm which you are proposing. Good luck for your project.
Hi,
Can anyone please tell me the basic theoretical explanation of what causes PAPR to change when I am going from DC to sine wave or triangular wave.
Thanks in advance
Akansha
@akansha: Well, let us consider
(a) DC : We know that the peak value of DC is same as the average value. Which means PAPR = 1 (0dB)
(b) Sine wave: If we consider a sine of sin(wt), its peak value is 1 and the average value 1/2. So the PAPR is 2 (3dB)
Agree?
can you help me.i need matlab code for an ofdm system to plot papr vs ber
@shomapto: Which parameter are you planning to control to vary the PAPR in your simulation model?
Hi Mr.Krishna.
Iam very Impressed by your contribution in solving OFDM problems such as PAPR reduction ,also I hope to help me by provide me code that necessary for this problem specially Clipping and filttering method.
@algenaby: Clipping should be reasonably easy to implement, no? The clipping can be implemented independently on the real and imaginary part as follows:
y(t) = x(t), if -thr < x(t) =thr
= -thr, if x(t) <= -thr
Following, this operation it can be followed by a simple fir filtering.
Thanks for your reply
Thanks for reply ,you mean after add perfix cyclic code the signal is x(t),and before add noise we examine the your condition on the signal x(t) for simple clipping and filter method
conditions are:-
—————————
y(t)=x(t) for x(t)<TH y(t)=TH oterwise
This condition can be applied on both real and imaginary part of x(t) independently
——————
@algenaby: In principle yes.
Make sure that you have clipping at -TH too.
Hi,
Can anyone please tell me how I can use data of my matlab file in RF tool box. Because to my knowledge we can only read data from file having extension as .amp,.snp,.hnp,.ynp.
I am unabe to read data from my matlab code.Please help.
Thanks in advance
From
Akansha
@akansha: Well I thought Matlab has lots of file reading options. Maybe this link Reading Data Files into MATLAB
http://www.mathworks.com/support/tech-notes/1400/1403.html
might provide you pointers.
hi Mr. Srinivasu may i know what problem u are facing
When I tried to normalise the ifft by multiply it with nFFTSize to be :
outputiFFT = nFFTSize * ifft(inputiFFT,nFFTSize);
When I calculate the PSD, I use :
[Pxx,W] = pwelch(st,[],[],4096,20);
Pxx=1/nFFTSize
but I notice that the PSD value is lower than in the original file where you did not normalise. Can you enlighten me about this?
@Claire: I believe you meant, Pxx=Pxx/nFFTSize (and not Pxx=1/nFFTSize).
On a lighter note, since nFFTSize > 1, it is reaonably to expect that your Pxx value is smaller, no? 😉
Hi Krishna,
Yes, you are right, the PXX=Pxx/nFFTsize. That’s right! Silly me. Thanks again!
I am wondering what is the different between windowing and filtering? Both try to shape the signals to particular setting. After clipping, we can use either window or filter to reduce the OOB but is it just preference? and some people use both filtering and windowing.
@Claire: Well, in windowing we try to multiply the time domain signal with a window.
In filtering, we convolve the timedomain signal with a filter taps.
Hope the explanation on wiki on windowing helps
http://en.wikipedia.org/wiki/Window_function
I think both the approaches helps to reduce the out of band spectrum. However, I have not used windowing, hence cannot comment much.
Dear sir
pl. send the OFDM model in matlab with dpsk modualtion and block codes as FEC
I will be thankfull u Sir
@ MVS Sairam: I have not tried simulating OFDM with DPSK modulation. However you maybe able to use posts on
(a) OFDM with BPSK modulation
https://dsplog.com/2008/06/10/ofdm-bpsk-bit-error/
(b) Coherent demodulation of DBPSK
https://dsplog.com/2007/09/30/coherent-demodulation-of-dbpsk/
as reference
I have not yet tried simulating block coding scheme. You may have a look at posts on
convolutional coding scheme @
(a) https://dsplog.com/tag/Viterbi/
(b) https://dsplog.com/2009/01/04/convolutional-code/
Hope this helps.
I am wondering why the result of the PAPR is not a smooth curve eventhough the total bits is high. I tried using semilogy but the result is a bit jagged. I see other PAPR graphs where the result is just a smooth curve. You may have a clue about this?
To show the PSD, can I use the code 10*log10(abs(fft(st,FFTSize)))? Do I need to fftshift again?
Thanks!
Just to clarify, the code I used is your PAPR code using 802.11a specification.
@claire: My replies:
1. Hmm… maybe if we use more number of OFDM symbols, we can get a smoother curve.
2. Yes, you need to use fftshift after fft to plot the spectrum from -fs/2 to fs/2.
i’m doing a project reduce Peak to Average Power Ratio for OFDM by clipping and filtering .Could some one help me with the code for this, thank!
@kenshiro: May I point you to a paper PAPR reduction by oversampling, soft clipping and filtering from Mitsubishi Electric.
PAPR Reduction for WiMAX OFDM Systems
http://www.merl.com/projects/papr/
Hope this helps.
In your last graph you wrote on the y-axis Pr,XPAPRo)?
@ilias: y-axis is the cumulative probability distribuition function
Hi,
baibhavshukla asked you (https://dsplog.com/2008/02/24/peak-to-average-power-ratio-for-ofdm/#comment-119) for a matlab code for PAPR reduction by tone reservation.
Have you worked on this topic since that time?
Thank you, and tribute for your blog.
@link: Sorry, I have not worked on papr reduction by tone reservation
I was wondering what references did you use for the PAPR for OFDM.
@ilias: hmm, i just referred the 802.11a specifications (having the scrambler).
hello i m doing a project on reducing the papr of an ofdm s/l.. could some one help me with the code for exponential companding…
@Mukund: Sorry, I am not familiar with using ‘exponential companding for reducing PAPR in OFDM’. Am sure that there will be people out there who are familiar. Please help.
Sir
How we can caliculate the PAPR of OFDM with block code. I will be greatfull to you Sir
—Sairam
@sairam: I am not sure how block coding affects the PAPR. I would think that as long as we ensure that the data is random, the PAPR for an OFDM symbol wont hit the theoretical maximum limits. You may refer to the post
https://dsplog.com/2008/02/24/peak-to-average-power-ratio-for-ofdm/
as a reference
sir i want plot of PAPR vs complimentry CDF
@manjeet: As you know, CCDF = 1-CDF. In the script you can do, plot(x,1-cumsum(n)/nSymbol,’LineWidth’,4) for obtaining CCDF.
sir it works but i want code of ofdm over fiber, ofdm over AWGN channels, PARR of ofdm signal
@saleem: Please look at https://dsplog.com/tag/ofdm/
Hi jenny..
I am also new to MATLAB.
Could you plz give me your mail id so that we can discuss on the same
@Jenny:
I think the effect of clipping and filtering is degradation of BER because there is self interference. So i guess you can try the combination clipping and filtering with coding technique
hi,i’m a beginner in MATLAB Simulink. Currently I’m using MATLAB Simulink for my project. The project is about Reducing Peak to Average Power Ratio (PAPR) in Orthogonal Frequency Division Multiplexing (OFDM) by using Clipping and Filtering. I have designed the clipping and filtering model and applied it into my OFDM system. Theoretically, high PAPR problem in OFDM system can be reduced by clipping method. However, clipping yields out-of-band interference. So, the clipped signal must be filtered. But, after clipped and filtered, the BER performance degraded (around 0.437..). How to get rid of this? Can you give guidance and help? Thanks…
@Jenny: Note that clipping produces both out-of-band and in-band interference. Only the out-of-band interference can be removed by filtering. The in-band interference CANNOT be removed and will cause SNR degradation (hence you observing the degraded BER performance). It is for this reason that clipping is not a preferred way for reducing PAPR.
hi,
I am doing research on “PAPR Reduction Techniques in OFDM”.I am not able to write MATLAB Code for various PAPR reduction techniques like Clipping,filtering and windowing. Could U please send me the code of these there techniques. I would be highly obliqued for that.
Thaks
@srabani mohapatra: Sorry, I do not have the code for these techniques. However, I think clipping will be reasonably easy to implement. For any signal level above a threshold, force it to the threshold value.
hi
i am doing my project in mimo-ofdm using reed solomon code to reduce the peak to average power ratio. pls tell about ur opinion that whether it has existed or not.
thank you
Hi!Naveenan! am Mahesh and am doing PAPR reduction in mc-cdma using Reed Solomon codes… I have some doubts about simulating it… can u h elp me..?
with hope,
Mahesh R
@Mahesh: Sorry, I am not familiar with the topic which you are proposing.
Dear Krishna.
Its realy nice. It answered many of my questions. Have you worked on reducing PAPR by clipping? If yes can you provide ‘anything’ on the subject. Matlab program will be great.
Well Done.
@Gulap: Though, I do not have simulation models for reducing PAPR by clipping, I would expect it to be reasonably simple to implement. It would be defining some upper and lower threshold values – any signal above or below that threshold will be saturated to the threshold.
Though, clipping is simple operation to implement, clipping being a non-linear operation can cause unwanted frequency components to be generated in the desired frequency band and outside the desired frequency band. Both are typically undesirable.
hi krishna
i want to simulate a MC-CDMA system that in it calculate PAPR and detect diffrent users with BER calculating for rayliegh channel and can not do this completly for this i ask you that if have no problem for you help and give me a matlab file about this problem
thanks a lot for your attention
@hossein: Sorry, I do not have a Matlab code which explicitly does this. For PAPR, you may refer to the posts
with the URI: https://dsplog.com/tag/papr/
Since MC-CDMA can be built upon OFDM simulations, you may refer to the posts with the URI: https://dsplog.com/tag/ofdm/
Hope this helps.
@Akansha: As I see, clipping is an operation where the I/Q signals are not allowed to cross a threshold. For example, if the signal swings from -1V to +1V and the clip threshold is +/-0.5V, then signals above 0.5V are forced to +0.5V and signals below -0.5V are forced to -0.5V.
This is a brute force way for reducing the PAPR. Clipping being a non-linear operation will create unwanted spectral components both in inband and outband of the desired spectrum.
I am not able to get how to implement PAPR reduction code using “Clipping Method”. Can you please help me.
Thanks
Akansha
Hi Akansha,
This is srabani.
I also doing project in PAPR reduction technique of OFDM.I am new to MATLAB,so i am facing some issues on that.
so i need ur help
I need the matlab code clipping and filttering of OFDM system.
Thanks
Srabani
hai akansha jain,
i am doing aproject based on repeated clippig and filtering for papr reduction, if u have any matlab codes please help me
@akansha: I have not done much study on PAPR reduction, except for a brief trial described at
https://dsplog.com/2008/07/02/ofdm-papr-reduction-multiplication-by-j/
You can find the a simple Matlab script also there.
Good luck. Thanks
hi,
I am doing research on “PAPR Reduction Techniques in OFDM”.I am not able to write MATLAB Code for various PAPR reduction techniques like Clipping,Companding,PTS etc. Could U please help me how I can proceed my work providing me with some example. I would be highly obliqued for that.
Thaks
@theogene: Can you please elaborate what you meant by wireless power received.
i would like to have a matlab code for wireless power received
Thank you
Thanks a lot man, you are great.
@umar: Yeah, sometimes the help is not so helpful 😉
Ok, let me start:
hist(paprSymboldB,[0:0.5:15]) function computes the number of instances where paprSymboldB take the value 0dB, 0.5dB, 1dB, 1.5dB,…14.5dB, 15dB respectively. The number of elements is stored in n; and x is same as [0:0.5:15].
From n and the knowledge of the total number of events, one can get probability density function. Further, by doing a cumulative sum cumsum(), one can get the cumulative distribution function.
Does this help?
Hi, I have one very basic question, and hope you will explain it to me in basic way, i am a novice in MATLAB.
What does this function actually do. I have copied it from your code. paprSymboldB is a 193 bits vector whereas 0:0.5:15 is a 31 bit vector. What is actually stored in n and x.
[n x] = hist(paprSymboldB,[0:0.5:15]);
Please dont use words like one are found in MATLAB help, which i am copying down.
N = HIST(Y) bins the elements of Y into 10 equally spaced containers and returns the number of elements in each container. If Y is a matrix, HIST works down the columns.
@Elibom: I tried to check the PAPR reduction by multiplying some subcarriers by j (as suggested in 802.11n 40MHz bandwidth). This operation does not reduce the PAPR for the random BPSK/QPSK case 🙁
Hi. Thanks for the prompt responses you provide to the questions. You know that for a high frequency, high bit rate OFDM signal-error vector magnitude (EVM) is an important parameter. Sometimes more important than PAPR-because even if the signal is clipped to a certain degree EVM can be very good.
Can you reflect on the relationship between EVM, SNR and BER of a QAM (QPSK is 4-QAM) OFDM signals? There is a paper titled -“On the extended relationships among EVM, BER and SNR as performance matrix.” But the equations there have problems. May be you can post some better references.
Hi. Do you have the code for SNR and BER of a QAM (QPSK is 4-QAM) OFDM signals? I am trying to find the BER. But i think my code does not work properly. If you have the code, please send the code at this email address: ayesaparvin@yahoo.com.
Thanks.
@Sakib: As the case with existing 802.11 devices, 802.11n is specified for both 2.4GHz and 5GHz band. The only aspect which people are still debating is to whether 40MHz 802.11n devices should be allowed in 2.4GHz band (as the spectrum is less in that band).
Further, if you are interested, the VHT (Very High Throughput) group is proposing to extend the wireless lan rates to 1Gbps. There are maybe two proposals, one using the 5GHz band and the other using 60GHz band (overlap with 802.15.3c). You may find the documents @
https://mentor.ieee.org/802.11/documents?x_group=0vht&x_options=0
Thanks. I know it is still in the draft stage. I know the fft size and other OFDM parameters but i am interested specially in the frequency band. Reports say they will be an extension of the current band (but 802.15.3 already have 3.1-10.6 Ghz). Also its not clear if they are going to use only 2.4 GHz and omit 5Ghz. If you can post some comment on the frequency band that will great.
@Sakib: As the 802.11n specification is still in the draft stage, it is not publically available. However, all the major documents used for discussion by the 802.11n Task Group is public domain and can be downloaded from
https://mentor.ieee.org/802.11/documents?x_group=000n&x_options=0
Hi I am looking for the new 802.11n PHY specification. I will be grateful if some one can post it.
Sakib
@Elibom: Oh yeah, good point. Infact, I think people have started using this approach. If you see the 802.11n High throughput PHY specification, in 40MHz mode, where 128pt FFT is used, the upper 64 subcarriers are multiplied by j.
As you said, I think, it will result in a lower PAPR. However, I have not done simulations to check. I will run a quick check and do a brief post.
just my 2 cents.
1) I feel like high PAPR is due to too many independent sub-signals to be added together. For example, 256-chip OFDM may have more chance of high PAPR than 64-chip OFDM.
2) for OFDM liked multi-carrier signals, if the signal is time-domain cyclic shift, it equals to frequency-domain phase rotation.
3) why not divide a, say, 256-chip OFDM signal into two, for example, 128-chip OFDM signals, and properly cyclic rotating one 128-chip OFDM tile the PAPR of the added signal is low enough.
any comments
@Anatoliy: I think most PAPR reduction algorithms require some inverse operations in the receiver. Maybe an approach (which is transparent to the receiver) is to use the information of PA non-linear behaviour and pre-distort the baseband signal such that the final output (baseband+PA) is linear. Just a thought.
Sorry, I do not think I can offer much help on this topic.
For instance, in this document offer to use the algorithm u-Law.But then must be used specialized receiver.What algorithm possible to use in modulator with usual home receiver DVB-T?
http://webfile.ru/2040388
@Anatoliy:
Sorry for the delayed response. I was out of town over the weekend.
I was unable to understand your question. What is compression method? Can you please point me to some references.
Hi
I have one question… please help. I need your help.
My question is: could we use the reduction method PAPR in DVB-T not only IEE 802.11? For a example, if we use the compression method then the constellation diagram will be distorted and common home-receiver can’t correctly receive a signal.
@Elibom: Thanks for the links.
@sakib: The variable which we are dealing is a complex number and our objective was to find the square of the absolute value of each element and then add them up.
As you may have figured, the way I did employs a trick using matrix algebra.
If xt is a vector of size [1 x N], then xt’ is the complex conjugate transpose vector of size [N x 1]. Then, it follows that xt*xt’ -> is a 1×1 matrix which is the sum of the power of absolute value of all the element.
Does that help?
Another interesting source for PAPR reduction I found is
http://to.swang.googlepages.com/peaktoaveragepowerratioreduction
http://to.swang.googlepages.com/C00-NTAH-20070827-008-LGE-PAPRReduct.pdf
I have question about the MATLAB code. Why we need to take complex transpose while calculating mean square vale?
Sakib
@Anatoliy: The best I have done to reduce the PAPR is to have a scrambler in place. The scrambler ensures that the long sequence of ones or zeros are avoided.
Some relevant links which I picked up from a quick Googling.
(a) Tone reservation : where some of the unused subcarriers in an OFDM system is modulated to reduce the PAPR.
(b) MERL has a paper on PAPR reduction by oversampling, soft clipping and filtering.
PAPR Reduction for WiMAX OFDM Systems
http://www.merl.com/projects/papr/
(c) Nice comp.dsp thread on this topic
Has The peak-to-average ratio problem of OFDM been solved?
http://tinyurl.com/6jn9ql
Sorry, I have not worked on any of the advanced methods. Hence unable to suggest one way or the other.
Good luck with you investigations. If you wish, kindly update us about your findings. It will be helpful to dsplog.com community 🙂
What methods of the reduction PAPR you may recommend?For instance for COFDM 8K?
@umar: May I point you to a often cited paper on this topic.
“Diversity and multiplexing: A fundamental tradeoff in multiple-antenna channels” – Lizhong Zheng Tse, D.N.C.
This paper appears in: Information Theory, IEEE Transactions on Publication Date: May 2003
http://www.eecs.berkeley.edu/~dtse/tradeoff.pdf
I have not studied the paper enough to write a post on it. However, I think that the paper should give you valuable pointers. Hope this helps.
Firstly thanks for the responce and sorry for the delayed question for i was not able to get to the desk.
Thanks for the BER v.s. distance help, i think i will manage something from the guidance given.
But for the SNR vs outage probability, i am afraid the pointer you have provided only allows access to few pages and that too the unimportant one. I would request you to please help me in this regard and tell me how can i calculate required or threshold rate from the general capacity equation and how can i get the graph between snr and outage as we have to varry the capacity and form there get the snr. I am totally confused, need urgent help.
May be you can write a blog-post for this point only.
Regards
@umar:
On a closer look at the queries, I think each of the questions requires a blog-post or more to explain… 🙂
Anyhow, let me try to provide my brief thoughts and some pointers.
Firstly, I do not have the Matlab code available for any of the simulation parameters listed below.
Trying to answer:
1)BER v.s. No of users (capacity)
[krishna] In an OFDMA system the number of users depends on the number of sub-carriers, each user being allocated a chunk of sub-carrriers. If the sub-carriers are orthogonal, the users do not interfere with each other. However, in the presence of frequency offset (and probably other impairments), there will be ICI (inter-carrier-interference) resulting in noise floor. Do you agree?
Where you looking for that?
2)BER v.s. distance
[krishna] This can be obtained from BER vs SNR plot.
If you get the path loss equations for the environment, for a given a transmit power, we can know the received power at a given distance. As the receiver noise bandwidth is fixed (typically equal to the signal bandwidth), the signal to noise ratio is defined. So, one can use path-loss to convert SNR to distance.
3)PDF v.s. CIR (dB)
[krishna] Probability distribution function (PDF?) of which event?
4)SNR vs outage probability
[krishna] Hopefully this link provides you pointers
http://tinyurl.com/4pvejj
5) No of users v.s rate sum capacity.
[krishna] No clue.
Further, you can look at Prof. Chockalingam’s publications listed in the URI: http://www.ece.iisc.ernet.in/~achockal/aboutme/tmp_node7.html
He has worked on schemes for cancellation of multiuser interference in OFDMA.
Hope this helps…
@Krishna Pillai
any of the way will be fine. but if it is a fresh post , please do send me the location.
Thanking you in anticipation,
umar
@umar: Thanks. I saw the email and I expect to respond mostly by today. If you agree, may I answer via the comments section OR as a fresh post?
@ Krishna Pillai.
Hi,
you are the man who has helped me in understanding the OFDMA concept and because of you I decided to do my project in it. But now i am stuck at a point and i want you to help/guide me through the problem. I have given you an personal email and i would request you to help me in understanding/solving the problem as well.
Regards
I have an article on understanding OFDM transmission
https://dsplog.com/2008/02/03/understanding-an-ofdm-transmission/
Is that what you were referring to? OR
Where you requesting for the derivation of Y = HX + N system model?
Hi …
Kindly upload a topic on the OFDM signal derivation equation…
thanx, i shall be thankful to you for help
@khizir: Thanks
Good post. I liked the article. Anyway I am a newcomer in this site. I was looking for a site something like this.
@subrahmanyam: Thanks 🙂
good to have the things in this way
good o see the valuble stuff
thank u
@baibhavshukla:
I have not worked on papr reduction in OFDM by tone reservation approch. If you can provide me the paper (or the link to it), we can discuss it and then hopefully comeup with a suitable matlab program.
You can find my email in the Contact Us page.
Dear Sir,
I have go through your paprofdmbpsk coding. In this code, i cant
understand some part of the coding. Can you please rectify the doubt?
My problems are:
1. inputiFFT(subcarrierIndex+nFFTSize/2+1)= ipMod(ii,:) what is
happening here…?
actually i think inputIFFT starts from (7 to 59) because subcarrier
index range -26 to 26.
but in MATLAB the array starts from 1 to 64.
2. what is happening in the program line
inputiFFT = fftshift(inputiFFT);
outputiFFT = 64*ifft(inputiFFT,nFFTSize)
3. finally the basic question whats the reason for range of ifft size
always twice the number of bits in symbol.
I am eagerly waiting for your reply. Because i am not sleeping well
due to finding the solutions.
Thanks and Regards,
Kalidoss.R
@kalidoss: My replies:
1. Please look into the post on understanding OFDM transmission and the post on Negative Frequency
https://dsplog.com/2008/02/03/understanding-an-ofdm-transmission/
https://dsplog.com/2008/08/08/negative-frequency/
The FFT output of index of [0 to 63]. Outof it indices from [32 to 63] alias and correponds to indices [-32 to -1].
2. fftshift() does the re-arrangement of sucbarriers to handle the aliasing
fftshift([0:7])
ans = [ 4 5 6 7 0 1 2 3 ]
3. Did not quite understand.
4. Sleep well. Typically, the answers come to us, when we sleep well.
I am doing project on PAPR reduction in OFDM by selective tone reservation method can you help me to ind matlab program
hi sir
i am doing a project based on papr reduction in ofdm via tone reservation.
can you help me to do this matlab program
@srinivasu: Sorry, I have not tried modeling PAPR reduction by tone-reservation.
hello sir
i am doing project in ofdm
@manisha: good
@srinivasu: Sorry, I have not tried modeling PAPR reduction by tone reservation
hai sir
i am doing project on papr reduction in ofdm via tone reservation. i have found a tag related to tone resevation in this site, his name is BAIBHAVSHUKLA.”please give me his contact details (id or phone number)”.
@srinivasu: I just sent an email to both of you. Hope it helps.
hi,
thanks for providing such helpful site. i got alot on this site for which i was looking for a long ………………….