 with transmit IQ gain/phase imbalance")
")
")
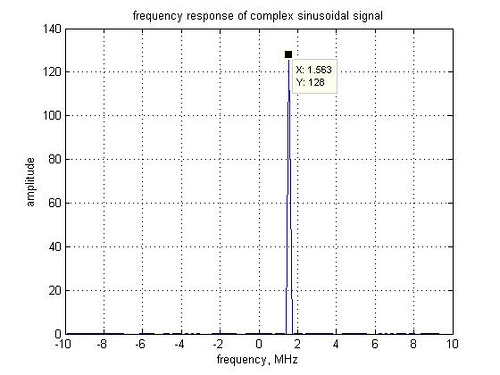
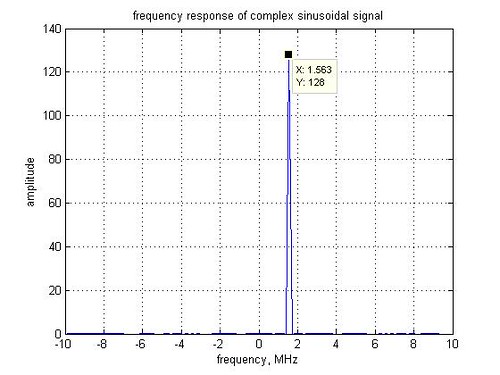
It might be interesting to interpret the output of the fft() function in Matlab. Consider the following simple examples.
fsMHz = 20; % sampling frequency
fcMHz = 1.5625; % signal frequency
N = 128; % fft size
% generating the time domain signal
x1T = exp(j*2*pi*fcMHz*[0:N-1]/fsMHz);
x1F = fft(x1T,N); % 128 pt FFT
figure;
plot([-N/2:N/2-1]*fsMHz/N,fftshift(abs(x1F))) ; % sub-carriers from [-128:127]
xlabel('frequency, MHz')
ylabel('amplitude')
title('frequency response of complex sinusoidal signal');
With anpoint fft() and sampling frequency of
, the observable spectrum from
is split to
sub-carriers.
Additionally, the signal at the output of fft() is from . As the frequencies from
get aliased to
, the operator fftshift() is used when plotting the spectrum.
In the example above, with a sampling frequency of 20MHz, the spectrum from [-10MHz, +10MHz) is divided into 128 sub-carriers with spaced apart by 20MHz/128 = 156.25kHz. The generated signal x1T of frequency 1.5625MHz corresponds to the information on the 10th sub-carrier, which can also be generated in the frequency domain.
% generating the frequency domain signal with subcarrier indices [-N/2:-1 dc 1:N/2-1]
x2F = [zeros(1,N/2) 0 zeros(1,9) 1 zeros(1,N/2-10-1)]; % valid frequency on 10th subcarrier, rest all zeros
x2T = N*ifft(fftshift(x2F)); % time domain signal using ifft()
% comparing the signals
diff = x2T - x1T;
err = diff*diff'/length(diff)
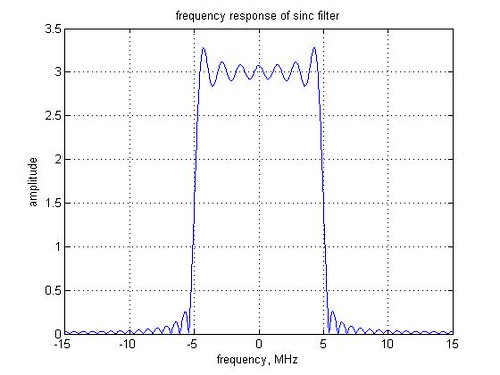
Plotting the frequency response of a filter
Consider a filter with the a sinc() shaped impulse response. The Matlab code for plotting the frequency response is as follows:
% impulse response of a sinc() filter
hT = sinc([-20:20]/3); % consider sample at 30MHz sampling;
hF = fft(hT,1024); % 128 pt FFT
figure;
plot([-512:511]*30/1024,fftshift(abs(hF))) ;
xlabel('frequency, MHz')
ylabel('amplitude')
title('frequency response of sinc filter');
Hopefully, the post provides some insights on the query raised in the comp.dsp thread.
good one 🙂
Hello Krishna
If the subcarrier spacing is 15KHz, and I want to map data to two sets of subcarries. center frequencies of two sets of data are separated by bandwidth of choice, as a part of a large IFFT.(Example: two sets of data (N1 qpsk symbols,N2 qpsk symbols) should be mapped onto the subcarriers of an IFFT of size N. After taking IFFT and plotting the power spectrum, the data sets occupying bandwith (of B1 and B2MHz,) need to be separated by a bandwidth of B3MHz (say 900 subcarriers))
Thank you.
@Vinay: Hoping that the post on understanding an OFDM transmission will be of help.
https://dsplog.com/2008/02/03/understanding-an-ofdm-transmission/
sir i want to reduce subcarriers 52 to 26 ……………………. what is the value of cyclic prefix plz reply
@jaspreet: The duration of the cyclic prefix is not dependent on the number of subcarriers. Rather it is dependent on the expected length of the channel impulse response (cyclic prefix should ideally be more than the channel duration).
Hello Sir,
I want to generate simple ofdm signal using matlab simulation. How can i do that.?Can you provide the code specification?
@urvik: Please refer to the following posts:
https://dsplog.com/2008/02/03/understanding-an-ofdm-transmission/
https://dsplog.com/2008/06/10/ofdm-bpsk-bit-error/
Hi Krishna,
I am trying to generate a real unipolar ofdm signal using 16 qam, 52 subcarriers and fft-size 64 to begin with. The way to generate unipolar ofdm is to modulate only odd subcarriers and the way to have real output from IFFT is to make the input vector have Hermitian symmetry. However, i am confused with the indices that matlab uses to designate subcarriers and the actual subcarriers. I want to simulate the BER performance of real unipolar OFDM in awgn channel. Can you please help? thanks.
@HariJo: To get a real output from the ifft, make the input conjugate symmetric. For example, playing with the Matlab code provided in
https://dsplog.com/2008/06/10/ofdm-bpsk-bit-error/
clear all
nFFT = 64; % fft size
nDSC = 52; % number of data subcarriers
nBitPerSym = 52; % number of bits per OFDM symbol (same as the number of subcarriers for BPSK)
nSym = 1; % number of symbols
% Transmitter
ipBit = rand(1,nBitPerSym*nSym) > 0.5; % random 1’s and 0’s
ipMod = 2*ipBit-1; % BPSK modulation 0 –> -1, 1 –> +1
ipMod = reshape(ipMod,nBitPerSym,nSym).’; % grouping into multiple symbolsa
xF_symm = [zeros(nSym,6) ipMod(:,[1:nBitPerSym/2]) zeros(nSym,1) ipMod(:,[nBitPerSym/2:-1:1]) zeros(nSym,5)] ;
xt_symm = (nFFT/sqrt(nDSC))*ifft(fftshift(xF_symm.’)).’;
hi,
i wanna know why fft/ifft is important in ofdm .does it play any signifinace role in ofdm
@saru: Hmm… in OFDM, we wish to send a group of complex sinewaves with each sine having different weights, and the frequency of the sine waves are integer multiplies of each other. Does it sound similar to what fft/ifft does?
Hi sir
can you explain how we do the channel estimation in ofdm 802.11
like in order to find the timing sync using cross correlation and auto correlation
In some papers they used something like
cross correlation of received signal with short preamble and divided it by auto correlation of short preamble , can you explain what exactly happens with this ?
@samba: In 802.11, the specification allows for a long training field (LTF) which is known a priori at the receiver.
The model is Y = HX + N,
where X is known at the receiver
N is the noise,
H is the channel
Y is the received signal
The noisy estimate of channel is H’ = Y/X
Hi krishna,
Are FFT size and sub-carrier number the same in OFDM? I was reading a paper and I was confused when I read 1201 occupied sub-carriers for 2048 FFT size. what does that mean?
Thank you in advance!
@teddy: FFT size and subcarrier number need not be the same. The text you mentioned means that out of 2048 available subcarriers, only 1201 are used.
Hi Krishna
i hope tht you are fine and doing good. i want to ask that why the output of fft i.e x1F is only at the 10th subcarrier?.
Thanking you in anticipation.
hi Krishna
i need to ask some basic questions
when we talk about ifft period,i.e 128,256…..are that subcarriers we are talking about?
how we define subcarriers spacings in matlab?
I could not really understand how to visualize an OFDM symbol in both time and frequency domain together,
@jahanzaib: My replies:
There are two aspects to consider –
fs – the sampling frequency of the ifft or fft
N – number of points
If we have an N point ifft running at sampling frequency of fs, then the subcarrier spacing is fs/N.
Typically in OFDM specifications, we the ifft size is equal to the maximum number of subcarriers which may be used. However, we do not use all the avaliable subcarriers.
A small typo in line 6 🙂
instead of xt I think it is x1T
Thanks
@Ashok: Thanks, I corrected it 🙂
Hi
I need a small help in plotting frequency spectrum of signal. I have plotted the frequency spectrum of signal using fft in matlab but the plot shows 2 spectrum. Could you please explain why.
@anisha: If its a real signal, then we have spectrum at +ve and -ve components. For eg, if we try to plot the spectrum of cos(wt), we will see spectrum at -w and +w. Does that answer your query?
Hi
In the FFT example of SINC function, could you please explain how the 30MHz sampling is implemented in the following line?
hT = sinc([-20:20]/3); % consider sample at 30MHz sampling;
@Leyo: The concept of time between the samples in Matlab is notional. It can be anyvalue. I just chose to use 30MHz so as to show the spectral plots from -15MHz to +15MHz [-fs/2 to fs/2).
I had chosen as 300MHz, the spectral plot will have changed to -150MHz to +150MHz.
Hope this helps.
@harikrishni: May I point you to the article by Richard Lyons on Computing Large DFTs Using Small FFTs will be helpful.
URI: http://www.dsprelated.com/showarticle/63.php
I want to do program of radix4 ( loop) pls help me